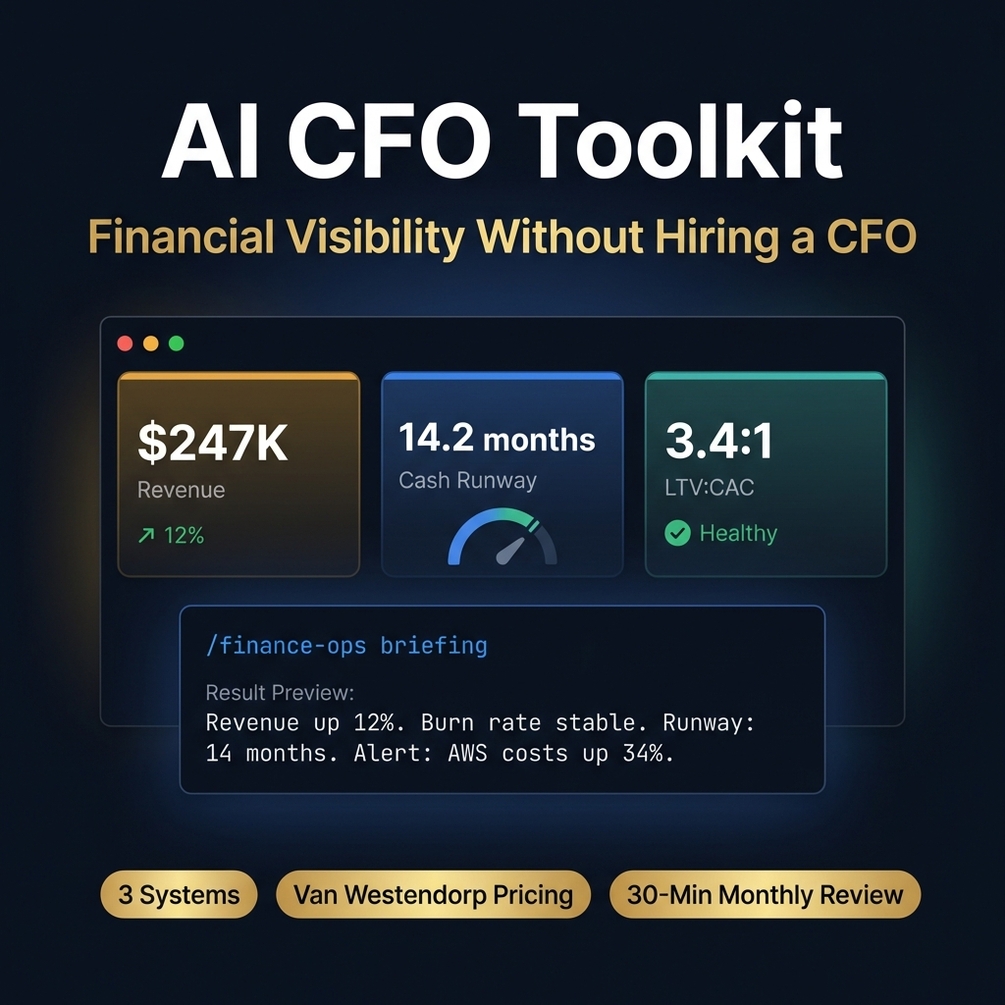
AI CFO Toolkit
Running a company blind. No CFO. No runway visibility. No pricing confidence. This toolkit gives you all three — 3 Claude Code skills, one 30-minute monthly session.
What's included:
- ✓3 Claude Code skills (finance-ops, pricing-strategy, analytics-tracking)
- ✓CFO briefing, cost estimator & scenario modeler (3 sub-commands)
- ✓Van Westendorp pricing research framework
- ✓Unit economics table (LTV:CAC, CAC Payback, NRR, Runway)
- ✓30-minute monthly review workflow
- ✓54.9 KB · works with Claude Code (free tier)
Instant download · No subscription · Free updates
Quick Answer
What problem does the AI CFO Toolkit solve?
Most solo founders operate without real financial visibility. They guess runway, set prices based on gut feel, and skip unit economics entirely because building the models takes time they don't have. The AI CFO Toolkit is 3 Claude Code skills — finance-ops, pricing-strategy, and analytics-tracking — that compress fractional CFO work into a repeatable 30-minute monthly session. You get P&L clarity, 3-scenario runway modeling, Van Westendorp pricing research, and a full unit economics table without hiring anyone.
Running a company blind. No CFO. No runway visibility.
“How many months of runway do I actually have?”
Estimated at 2am, never modeled
“Am I pricing too low and losing margin?”
Gut feel, no research behind it
“What does building this feature really cost?”
Dev time + infra + opportunity cost ignored
“If churn spikes 20%, when do I hit zero?”
Scenario never run
“Should I raise now or wait 6 months?”
No data to frame the decision
“Is my LTV:CAC ratio healthy or a red flag?”
Calculated once, never revisited
You know your product cold. Your financial picture is a different story. A fractional CFO costs $3,000–8,000 a month. A full-time hire is off the table pre-Series A. The AI CFO Toolkit gives you the same structured output — monthly briefing, scenario model, pricing analysis, unit economics — for $29 and half an hour.
The finance-ops skill system
3 sub-commands, one complete financial picture
CFO Briefing
Your full monthly financial picture — P&L, burn, and runway alerts — generated from raw inputs in minutes.
- →P&L summary (MRR, ARR, costs, net)
- →Cash burn rate & month-over-month trend
- →Runway in months (3 scenarios)
- →Top 3 alerts with recommended actions
Cost Estimator
Know the true cost of any feature before you commit one hour of engineering time to it.
- →Dev hours × fully-loaded hourly cost
- →Infrastructure and API costs at scale
- →Opportunity cost of what you won't build instead
- →Break-even customer count
Scenario Modeler
Model 3 growth trajectories and see exactly when each one hits a decision trigger.
- →Conservative: growth slows 30%
- →Base: current trajectory holds
- →Optimistic: growth accelerates 50%
- →Decision trigger: when to raise or cut spend
# Monthly 30-min review session
$ /finance-ops/briefing
→ P&L: MRR $12,400 | Costs $6,200 | Net $6,200
→ Runway: 14.2 months (base) | 9.1 mo (conservative)
⚠ Alert: Infra costs up 22% MoM — investigate
$ /finance-ops/scenario growth_rate=0.15
→ Conservative: $14,260 MRR in 6mo | runway 11mo
→ Base: $17,800 MRR in 6mo | runway 16mo
→ Optimistic: $23,400 MRR in 6mo | runway 22mo
$ /pricing-strategy research product="SaaS plan"
→ Van Westendorp range: $49–$99 (sweet spot: $69)
→ Recommended tiers: $39 / $69 / $129
$ /analytics-tracking monthly
→ CAC: $42 | LTV: $384 | LTV:CAC 9.1x ✓
→ CAC Payback: 3.4 months | NRR: 108%
✓ Monthly review complete — 28 minutes
Pricing strategy skill
Stop leaving revenue on the table — price with research behind you, not gut feel
Van Westendorp Framework
Four questions that map your acceptable price range directly from customer psychology — not benchmarks from someone else's market.
3-Tier Pricing Builder
Converts your Van Westendorp output into a 3-tier structure with anchor pricing logic that makes your target plan convert harder.
Starter
Remove friction, capture price-sensitive buyers
Pro
Most popular — engineered for conversion
Scale
Anchor tier — makes Pro feel like a bargain
Freemium vs Free Trial
The skill evaluates your product type, average contract value, and activation complexity — then gives a clear recommendation with the reasoning written out.
Unit economics table
| Metric | Formula | Healthy Range | Red Flag |
|---|---|---|---|
| LTV:CAC | LTV ÷ CAC | ≥ 3x | < 1x |
| CAC Payback | CAC ÷ Monthly Gross Margin | < 12 months | > 24 months |
| Net Revenue Retention | (MRR end – churn – contraction + expansion) ÷ MRR start | > 100% | < 80% |
| Runway | Cash ÷ Monthly Burn | > 18 months | < 6 months |
| Gross Margin | (Revenue – COGS) ÷ Revenue | > 70% (SaaS) | < 40% |
| Magic Number | Net New ARR ÷ Prior Quarter S&M Spend × 4 | > 0.75 | < 0.5 |
The analytics-tracking skill populates this table from your monthly inputs and surfaces any metric outside its healthy range with a plain-language alert.
30-minute monthly review workflow
Six steps. Once a month. The financial catch-up call you never had — but always needed.
CFO Briefing
Run /finance-ops/briefing. Review P&L, burn rate, and runway across all 3 scenarios. Act on any alerts.
Scenario Update
Run /finance-ops/scenario. Check whether base-case trajectory is tracking or drifting toward conservative.
Cost Review
Run /finance-ops/cost-estimate for each feature entering next sprint. Know the true cost before you build.
Pricing Check
Run /pricing-strategy if you are testing plan changes, launching a new tier, or evaluating an upsell path.
Unit Economics
Run /analytics-tracking monthly. Surface any metric outside its healthy range and log the trend.
Decision Log
Write 3 concrete decisions the data supports. Date them. Pull them up next month to verify you followed through.
Who this is for
Built for you if you are:
Probably not right if you:
Frequently asked questions
Do I need a finance background to use this?↓
No finance background required. You provide raw inputs — monthly revenue, cost line items, customer counts, churn rate — and the skills produce structured financial output. The toolkit is built for operators who know their business but don't know how to read a cash flow statement.
What is the Van Westendorp pricing model?↓
Van Westendorp is a research-based pricing method that surfaces your acceptable price range using four customer questions: the price that triggers quality doubt, the price that feels like a bargain, the price that feels expensive but acceptable, and the threshold where customers walk. The pricing-strategy skill automates this framework and converts the output into a 3-tier pricing structure.
Does this replace accounting software?↓
No. The AI CFO Toolkit is a decision-support layer on top of your existing numbers — not a replacement for QuickBooks, Xero, or a spreadsheet. You bring the data; the skills turn it into analysis, alerts, and action items.
What does the 30-minute monthly review actually cover?↓
The review runs five skill commands sequentially: CFO briefing (P&L, burn, runway), scenario update (3 growth paths), cost estimate review (features entering next sprint), pricing check (if relevant), and unit economics table (LTV:CAC, payback, NRR, gross margin). The sixth step is a 5-minute decision log you write yourself based on the outputs.
What Claude plan do I need?↓
Claude Code on the free tier handles the standard monthly review workflow. Founders running cost estimates across multiple features in a single session may reach free-tier limits — Claude Pro at $20/month resolves that without changing how the skills work.
AI CFO Toolkit
Stop flying blind. Know your numbers.
$29 one-time. 30 minutes a month. Runway clarity, pricing confidence, and unit economics — without the CFO bill.
Get AI CFO Toolkit — $29Instant download · Lifetime access · Free updates